تمرين -1-:
plot(y)
plot(rand(1, 20))
يرسم الخط البياني بين أرقام
عشوائية مختارة ما بين 1-20 .

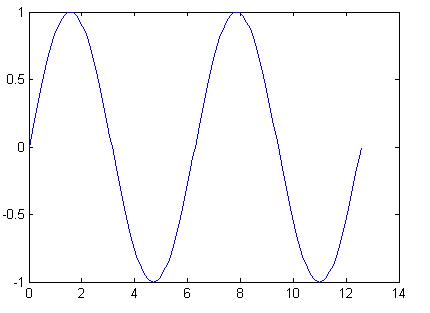
تمرين -2-: plot(x,f(x))
x=0:pi/40:4*pi;
plot(x, sin(x))
تمرين -3- :
رسم عدة منحنيات على شكل واحد
1.
Hold on\off
2.
plot(x1, y1, x2, y2, x3,
y3, ... )
3. plotyy (X1,Y1,X2,Y2)
- - - - - -- - - - -- - - - -
x=0:0.005:7;
y=sin(x);
y2 = sin(x-.25);
y3 = sin(x-.5);
plot(x,y,x,y2,x,y3)
legend('sin(x)','sin(-x.25)','sin(-x.5)')

تمرين -4- :
x1 = 0:pi/100:2*pi;
x2 = 0:pi/10:2*pi;
plot(x1,sin(x1),'r:',x2,sin(x2),'r+')

تمرين -5- :
الرسم المساحي
الرسم المساحي
Y= [1, 5, 3;
3, 2, 7;1, 5, 3;
2, 6, 1];
area(Y)
grid on
colormap summer
set(gca,'Layer','top')

تمرين -6- :
t = 0:pi/10:2*pi;
plot(exp(i*t),'-o')
axis equal

تمرين -7- :
الرسم القطبي
t = 0:.01:2*pi;
polar(t,sin(2*t).*cos(2*t),'--r')

تمرين -8- :
th = 0:pi/16:pi;
z = exp((-0.5+2*i)*th);
feather(z)

تمرين -9- :
الرسم العامودي
x = 0:pi/20:pi;
bar(x,sin(x))

تمرين -10- :
pie(rand(1,10))

تمرين -11- :
t = 0:pi/20:4*pi;
fill(t,sin(t),'g')

تمرين -12- :
k=5;
n=2^k-1;
[x,y,z]=sphere(n);
c=hadamard(2^k);
surf(x,y,z,c)
colormap([1 1 0;0 1 1])
axis equal


13 تمرين
مثال :
برنامج لرسم تغيرات التابع البسيط (y= A sin(wt مع تغيرات الزمن.
t=0:0.001:0.1;
A=220;
f=50;
w=2*pi*f;
y=A*sin(w*t);
plot(t,y,'k-')
title('Voltage curve');
xlabel('time [sec]');
ylabel('Amplitude [V]');
grid on;
pause
plot(y,t,'k-')
title('Voltage curve');
xlabel('Amplitude [V]');
ylabel('time [sec]');
grid on;
في درس سابق سبق وشرحنا عن تابع pause, حيث هذا التابع يقوم بإيقاف البرنامج حتى يضغط المستخدم أي زر ليتمم عمل البرنامج حتى نهايته , في مثالنا هذا يقوم البرنامج بعملية الرسم وفق العلاقة ('-plot(t,y,’k
وعندما يضغط المستخدم أي زر من لوحة المفاتيح فإن البرنامج سوف يحذف الرسم ليرسم وفقاً للعلاقة ('-plot(y,t,’k .